32 condo units sold at a loss in April, the biggest at $4.65m

PHOTO: 99.co
With home prices at an all-time high, it can seem like a good time to sell your property. Because there’s a higher likelihood of getting some capital gains.
Earlier this week, 99.co did an article covering condo resale transactions in April 2023 that made a gain of at least 200 per cent.
Today, we’re focusing on the condo resale transactions in April 2023 (from URA data, captured as of May 16, 2023) that made a capital loss.
| Condo name | Region | District | Size (sqft) | Purchase price and date | Sale price and date | Capital loss | Years held | Annualised loss |
| One Shenton | CCR | 1 | 1,184 | S$2.09m
30 Aug 2007 |
S$2.06m
12 Apr 2023 |
(S$32.5k)
-1.6% |
16 | -0.10% |
| One Shenton | CCR | 1 | 947 | S$1.66m
28 Nov 2008 |
S$1.41m
6 Apr 2023 |
(S$245k)
-14.8% |
15 | -1.06% |
| Marina Bay Suites | CCR | 1 | 2,680 | S$6.39m
29 Dec 2009 |
S$5.25m
10 Apr 2023 |
(S$1.14m)
-17.8% |
14 | -1.39% |
| Marina Bay Residences | CCR | 1 | 732 | S$1.72m
25 Mar 2010 |
S$1.54m
13 Apr 2023 |
(S$183k)
-10.6% |
13 | -0.86% |
| Icon | CCR | 2 | 581 | S$1.13m
30 Dec 2013 |
S$1.05m
5 Apr 2023 |
(S$80k)
-7.1% |
10 | -0.73% |
| 76 Shenton | CCR | 2 | 624 | S$1.47m
15 Apr 2010 |
S$1.38m
4 Apr 2023 |
(S$93.1k)
-6.3% |
13 | -0.50% |
| Eon Shenton | CCR | 2 | 538 | S$1.43m
2 May 2012 |
S$1.32m
25 Apr 2023 |
(S$107k)
-7.5% |
11 | -0.70% |
| Eon Shenton | CCR | 2 | 646 | S$1.47m
30 Jan 2013 |
S$1.35m
18 Apr 2023 |
(S$119k)
-8.1% |
10 | -0.84% |
| River Place | RCR | 3 | 1,895 | S$2.41m
3 Dec 2010 |
S$2.3m
14 Apr 2023 |
(S$105k)
-4.4% |
13 | -0.34% |
| Seascape | CCR | 4 | 3,380 | S$9.6m
10 Nov 2011 |
S$5.5m
28 Apr 2023 |
(S$4.1m)
-42.7% |
12 | -4.54% |
| Marina Collection | CCR | 4 | 3,272 | S$9.3m
27 Mar 2008 |
S$4.65m
3 Apr 2023 |
(S$4.65m)
-50.0% |
15 | -4.51% |
| Reflections At Keppel Bay | RCR | 4 | 1,614 | S$3.77m
8 May 2007 |
S$3.01m
3 Apr 2023 |
(S$764k)
-20.2% |
16 | -1.40% |
| One-north Residences | RCR | 5 | 1,120 | S$1.4m
13 Nov 2013 |
S$1.33m
24 Apr 2023 |
(S$70k)
-5.0% |
10 | -0.51% |
| Jool Suites | RCR | 8 | 936 | S$1.18m
30 Sep 2014 |
S$1.1m
14 Apr 2023 |
(S$80k)
-6.8% |
9 | -0.78% |
| Sophia Hills | CCR | 9 | 506 | S$1.26m
29 Jun 2018 |
S$1.15m
27 Apr 2023 |
(S$110k)
-8.7% |
5 | -1.81% |
| Sophia Hills | CCR | 9 | 571 | S$1.14m
8 Oct 2017 |
S$1.12m
3 Apr 2023 |
(S$17k)
-1.5% |
6 | -0.25% |
| Sophia Hills | CCR | 9 | 700 | S$1.45m
26 Jul 2017 |
S$1.45m
20 Apr 2023 |
(S$4k)
-0.3% |
6 | -0.05% |
| 8 Saint Thomas | CCR | 9 | 807 | S$2.63m
9 Oct 2018 |
S$2.53m
24 Apr 2023 |
(S$100k)
-3.8% |
5 | -0.77% |
| Cairnhill Nine | CCR | 9 | 754 | S$1.88m
21 Mar 2016 |
S$1.85m
6 Apr 2023 |
(S$34k)
-1.8% |
7 | -0.26% |
| Helios Residences | CCR | 9 | 1,281 | S$4.98m
2 Nov 2012 |
S$3.15m
21 Apr 2023 |
(S$1.83m)
-36.8% |
11 | -4.08% |
| Waterscape at Cavenagh | CCR | 9 | 1,184 | S$2.47m
14 May 2010 |
S$2.23m
12 Apr 2023 |
(S$235k)
-9.5% |
13 | -0.77% |
| St. Regis Residences | CCR | 10 | 6,059 | S$14.2m
3 Sep 2010 |
S$13.5m
6 Apr 2023 |
(S$741k)
-5.2% |
13 | -0.41% |
| 8 Bassein | CCR | 11 | 452 | S$873k
29 Oct 2012 |
S$870k
28 Apr 2023 |
(S$3k)
-0.3% |
11 | -0.03% |
| Daisy Suites | OCR | 13 | 764 | S$1.18m
6 May 2013 |
S$1.11m
11 Apr 2023 |
(S$70k)
-6.0% |
10 | -0.61% |
| Avant Residences | RCR | 14 | 388 | S$669k
23 Apr 2018 |
S$660k
14 Apr 2023 |
(S$8.5k)
-1.3% |
5 | -0.26% |
| Shiro | OCR | 15 | 452 | S$647k
26 Jun 2012 |
S$640k
20 Apr 2023 |
(S$6.56k)
-1.0% |
11 | -0.09% |
| Kingsford Waterbay | OCR | 19 | 850 | S$1.15m
7 Sep 2018 |
S$1.01m
21 Apr 2023 |
(S$139k)
-12.1% |
5 | -2.55% |
| Jardin | RCR | 21 | 1,701 | S$3.24m
25 Apr 2012 |
S$3.05m
26 Apr 2023 |
(S$185k)
-5.7% |
11 | -0.53% |
| The Creek @ Bukit | RCR | 21 | 1,571 | S$2.49m
14 Dec 2017 |
S$2.3m
13 Apr 2023 |
(S$192k)
-7.7% |
6 | -1.32% |
| Northvale | OCR | 23 | 1,087 | S$960k
12 Nov 2013 |
S$950k
3 Apr 2023 |
(S$10k)
-1.0% |
10 | -0.10% |
| The Tennery | OCR | 23 | 861 | S$1.09m
24 Jan 2011 |
S$1.06m
20 Apr 2023 |
(S$33.2k)
-3.0% |
12 | -0.26% |
| The Tennery | OCR | 23 | 614 | S$837k
10 May 2011 |
S$820k
17 Apr 2023 |
(S$17k)
-2.0% |
12 | -0.17% |
Figures (except floor area) are rounded off to three significant figures.
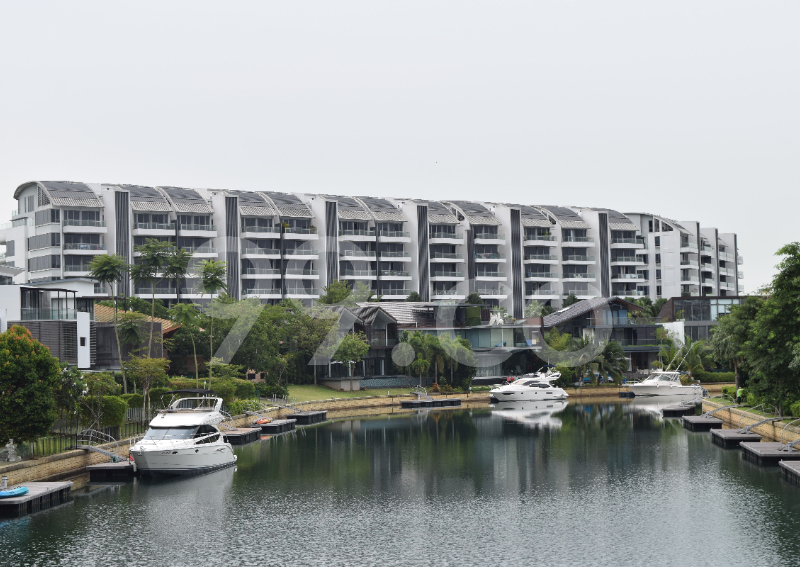
Among these loss-making transactions, the one that stood out the most to us was the sale of a 3,272 sq ft unit at Marina Collection in Sentosa Cove, as it made the biggest capital loss of $4,645,000.
Bought in 2008 for $9,295,000, the unit was sold last month for $4,650,000 — around half of the purchase price.
On top of that, it made the biggest capital loss in the month in terms of percentage. It also recorded the second-highest annualised loss in the month at 4.51 per cent.
The Marina Collection unit isn’t the only condo unit in Sentosa Cove that made a significant loss, though. The other loss-making unit was from Seascape. In fact, it had the second-highest loss last month at $4,100,000.
Bought in 2011 for $9,600,000, the 3,380 sq ft unit was sold at $5,500,000 last month. Compared with the other loss-making units, it recorded the second-highest loss percentage-wise. But when annualised, it made the highest capital loss at 4.54 per cent.
At the same time, it should be noted that among these 32 units that sold at a loss last month, only eight units (or 25 per cent) made a capital loss of at least 10 per cent. Meanwhile, the remaining 75 per cent made a capital loss ranging from 0.3 per cent to 9.5 per cent.
In terms of quantum, four units (12.5 per cent) clocked a loss of at least $1 million last month, while 13 units (40.6 per cent) made a loss of at least $100,000. The remaining 15 units (46.9 per cent) recorded a loss ranging from $3,000 to $93,100.
When broken down by regions, the CCR saw the highest number of loss-making units in April 2023 with 19 units (59.4 per cent). This is followed by the RCR at seven units (21.9 per cent) and the OCR at six units (18.6 per cent).
Another trend that caught our attention was that more than half of the loss-making units (19 out of 32 units) last month were smaller than 1,000 sq ft.
Smaller units such as one-bedders and two-bedders tend to be investment units, which home owners rent out for rental income.
Now, given the sky-high rental prices, it may be a good time to be a landlord. Amid a supply crunch, some tenants are willing to pay more to secure a rental unit.
At the same time, interest rates are rising, leading to higher monthly instalments for home loans.
Of course, there are many reasons why investors may decide to sell off their properties. But for those who depend on rental income to cover their monthly instalments, the rising interest rates may be too much for them to stomach.
Rather than risk getting overleveraged, some investors may decide to exit the market.
99.co also noted that 23 (71.9 per cent) of the loss-making units last month had a holding period of at least 10 years.
In fact, when we looked closer at the purchase dates, 28 (87.5 per cent) of the loss-making units were bought during the previous property booms, such as in 2007, 2010 - 2013 and 2016 - 2018.
Given that most of the units were purchased when prices were high, home owners may have been reluctant to sell them off, hoping to get the right price to exit the market.
But with several factors such as economic uncertainties, interest rates and cooling measures threatening to slow down private property prices, it may seem like a good time to sell it off sooner rather than later.
ALSO READ: 5-room HDB DBSS flat in Bedok sold for $1m